In part 1 of this tutorial series, we installed the GNU ARM GCC toolchain and the Eclipse IDE in order to develop for our ARM microcontrollers. In part 2, we configured the correct compiler and linker settings to get the STM32F0DISCOVERY demo code to build. In part 3, we pared down the demo project into a template to use for all of our future projects for the STM32F0 chip. And in part 4, we build a 'BlinkyLED' program from the template that uses the two LEDs and the user button on the STM32F0DISCOVERY board.
The previous tutorials are all you need to get things up and running on your STM32F0DISCOVERY board... as long as your code works the first time. If your code doesn't work the first time (like, say, my code), you'll want to add some debugging features to your build environment. If you're accustomed to writing code on a desktop computer using a modern IDE such as Visual Studio, you're used to being able to single-step through your code in the debugger from the source code, you're used to examining and modifying the contents of variables when you've broken into your code execution, and you're used to setting breakpoints in your source code. This functionality is (relatively) easy to accomplish on a desktop computer, but things get pretty tricky when trying to do the same things on an embedded platform. The STM32F0 chip has 64K of program space. Shoehorning a complex debugger into that code space along with your application code can be problematic.
Overview of On-Chip Debugging
The solution to this problem is to use what is called "on-chip debugging." On-chip debugging utilizes a small-footprint interface to the microcontroller (two pins in our case) that allow an external debugger to control the processor. Software on our desktop machine can talk to the debugger and give us the rich debugging environment we're used to. In order for Eclipse to talk to our chip, we need two things: we need the hardware to handle communications between the chip and the host computer, and we need the appropriate software on the host computer. The ST-LINK debugger on the STM32F0DISCOVERY board is the hardware part of this interface. The ST-LINK in-circuit debugger/programmer is actually implemented in an STM32F103C8T6 processor according to both the STM32F0DISCVOVERY schematics and the ST-LINK product documentation. (ST-LINK is sold as a standalone product by ST. We get one "for free" on our STM32F0Discovery board.)
You can learn more about ST-LINK on ST's product page for the standalone version of the device. The documentation is somewhat open to interpretation, but it appears that ST-LINK can communicate with the target microcontroller via one of two interfaces: the SWIM interface, or the JTAG/SWD interface. (Which is confusing because it appears to me that JTAG and SWD are two different interfaces.) The ST-LINK integrated into the STM32F0DISCOVERY board is connected to the STM32F0 via the SWD interface. SWD claims to be a "2 wire" interface, but a common ground is of course necessary as well. In addition, access to the target system's VCC and RESET pins are also handy, but apparently not necessary, for SWD debugging. The SWD connector on the STM32F0DISCOVERY board can be used when using the STM32F0DISCOVERY board as a standalone ST-LINK programmer. The SWD connector is a 6-pin connector with VDD_TARGET, SWCLK, GND, SWDIO, NRST, and SWO pins.
Since the ST-LINK device and the STM32F0 target device are on the same physical circuit board, they already share a common ground and VCC. The other connections used in the Serial Wire Debug (SWD) connection are the SWCLK (PA14, pin 49), SWO (PB3, pin 55), NRST (pin 7) and SWDAT (PA13, pin 46). It appears that the STM32F0's PA9 and PA10 pins (the USART1 TX and RX ports) are wired between to the ST-LINK device as well, although to the best of my knowledge these pins are unused. (Perhaps a 'serial port debug' USB connection may be available through ST-LINK in the future?) The use of SWO/PB3 is 'reserved' according to the STM32F0DISCOVERY documentation and is governed by solder bridge 22. This bridge is connected on my board. I have no idea what it does.
Let's put this hardware to good use!
Step 1: Download the ST-LINK Utility
ST provides a free utility for working with ST-LINK. Although we won't be using the utility in these tutorials, the software package for the utility includes the USB driver for the ST-LINK, which we need. So download and install the ST-LINK utility, if you haven't done so already in part 2 of this tutorial series. If prompted, allow Windows to install the unsigned driver. You can find the utility from the "Design support" tab of the ST-LINK product page on ST's website.
Step 2: Download OpenOCD
Since we already have the hardware needed to do on-chip debugging, let's get the software we need. Open OCD is an active open-source project designed to translate the signaling between ST-LINK (and, in fact, several other hardware debuggers), and GDB, the GNU Project Debugger. Eclipse will talk to GDB, which will talk to OpenOCD, which will talk to ST-LINK, which will talk to our target chip.
OpenGDB has a project page on sourceforge. Freddie Chopin hosts a download page for the Windows version of OpenOCD. Head over there to grab the latest version of OpenOCD, which is version 0.6.0 as I write this. Extract the files to a convenient location on your hard drive. I used C:\OpenOCD-0.6.0 on my machine.
Step 3: Launch OpenOCD and Connect to the Target Board
Ensure that the STM32F0DISCOVERY board is connected to your computer via the USB cable, and start OpenOCD with the following command:
openocd-0.6.0.exe -f board\stm32f0discovery.cfg
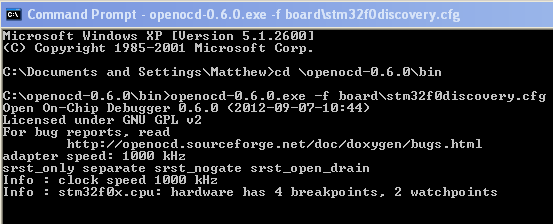
You should see something like this:
By the way, if Windows Firewall asks if you want to unblock OpenOCD from accepting network connections, click on Unblock. OpenOCD opens some TCP ports for Telnet and GDB connections; without unblocking this application, Windows Firewall won't allow you to connect to OpenOCD.
The Info: lines tell us that we've successfully connected to the ST-LINK debugger. Let's execute some commands via OpenOCD and see if we can get output that'll give us some confidence in OpenOCD. Start a telnet session to port 4444, the port on which OpenOCD is listening. Open a (new) command prompt window and type:
telnet localhost 4444
In the telnet window you should get a banner "Open On-Chip Debugger" and a ">" prompt. In the OpenOCD window, you should see "Info: accepting 'telnet' connection from 4444.' (If you're running Windows 7 you may need to install the telnet client: go to Control Panel, then Programs, then Turn Windows features on and off, then check "Telnet Client" and click OK.)
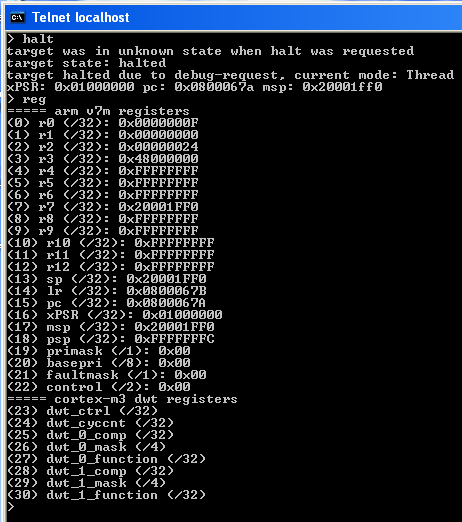
In the telnet window, type the command 'halt' and press Enter. This tells OpenOCD to halt the processor. You should get confirmation that the target is halted:
This is cause for optimism: not only does OpenOCD recognize that it has the processor in the halted state, the PC register (program counter) is a 'sane' value. Remember, Flash ROM starts at 0x08000000. My PC is at 0x0800067a, which is reasonably close to the start of program space.
Dump the processor's registers with the 'reg' command:
You're likely to see different values than I have here, but the fact that OpenOCD can talk to ST-LINK and access the target microcontroller's registers is a supremely good sign. We can single-step the processor with the command 'step':
This concerns me. I've single-stepped the processor three times and the PC hasn't advanced. Now, at the moment, I'm not entirely sure what code I have on this board; I was playing around getting my tools to work with some simple test code. I hope that I have a 'loop forever' construct at 0x0800067a. Let's dump the memory at this location and find out. The mdw/mdh/mdb commands can be used to dump memory as words (32 bits), halfwords (16 bits) or bytes. I entered 'mdb 0x0800067a 0x10' to dump 32 bytes of data at this memory location:
The hex value FE E7 opcode is an unconditional branch to relative location 11111111110, which is a 'branch here' instruction per the examples in section 5.18.2 of the THUMB instruction set document I was able to find. So I'm a lot more comfortable now seeing that my PC isn't advancing when I single-step my code. And I'm convinced that OpenOCD is, in fact, connecting to ST-LINK and getting valid data back from the processor. One last check: I'll halt the processor, manually set the PC register to 0x08000000, and single-step through some code and ensure PC advances:
My Program Counter advanced by two bytes every time I single stepped the processor. This is another Happy Dance moment!
Let's get ambitious and load our BlinkyLEDs code into the STM32F0. In the telnet window, enter the following commands, in order:
halt
flash erase_sector 0 0 last
flash write_image {c:\ARM_Development\STM32F0\BlinkyLEDs\Debug\BlinkyLEDs.elf} 0 elf
reset
The first command halts the processor, which is necessary before erasing the flash memory.
The second command erases the flash memory. The parameters indicate we want to erase flash bank 0 (the only bank of flash on this particular part) from the first sector to the last.
The third command is a flash command to OpenOCD. The command itself is 'write_image.' We give the full path to the .elf file that the linker created. Note that the path is enclosed in curly braces. This is because Tcl, the scripting language used by OpenOCD, was originally written for the Linux environment, which uses the forward slash as a path separator. To convince OpenOCD to recognize the backslash as a path separator, the path must be enclosed in curly braces. The number 0 is the number of bytes to offset the image in memory, and the 'elf' parameter tells OpenOCD the filetype of the image we're uploading.
The last command resets the processor and causes it to begin executing our code. Press the USER button on the dev board and note the results.
And yes... do the Happy Dance. This time for real.
Step 3: Connect Eclipse to OpenOCD
Now, interacting with OpenOCD through a telnet session is nice, but it's not exactly the most efficient way to work. We want Eclipse to interface with our target processor via OpenOCD. This is the last step of our long journey to open-source ARM programming nirvana. We're going to configure Eclipse to talk to arm-none-eabi-gdb, the GDB client. The GDB client will talk to OpenOCD, the GDB server. The GDB server will talk to ST-LINK, and ST-LINK will talk to the STM32F0.
Easy, right?
Let's install the GDB client software into Eclipse. If you don't have it done already, launch Eclipse and open your workspace. (Go ahead and close the two command prompt windows for now.) From the Help menu, select Install New Software. In the Work with dropdown, select "Juno - http://download.eclipse.org/releases/juno." In the list of software packages, expand Mobile and Device Development, and check the "C/C++ GDB Hardware Debugging" package. Click Next, click Next, accept the license agreement, and click Finish. Allow Eclipse to restart when the installation is complete.
Step 4: Configure a Debug Configuration
The debug environment is called a 'configuration' in Eclipse. On your main toolbar, click the dropdown next to the debug icon and select Debug Configurations.
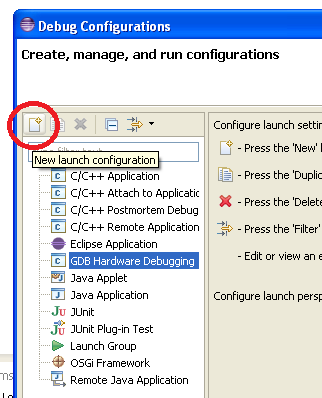
Click on "GDB Hardware Debugging" in the list of configuration types, and then click the "New" icon in the top left:
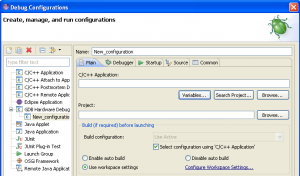
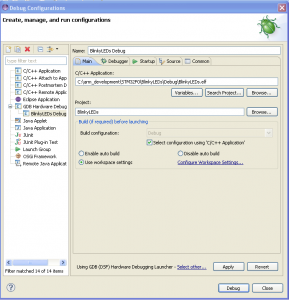
This will bring up an interface that will allow you to edit a new debug configuration:
In order to get a configuration working, we must specify a C/C++ application to debug in the first textbox. It seems silly to me to create a separate configuration for each project I work on. The presence of a button labeled "Variables..." suggests that it should be possible to create a debugging configuration that will automagically debug the project that I happen to be working with. Alas, I was not able to figure out how to get this to work, despite quite a bit of effort. Maybe I'll figure it out and post it in a future blog post.
In the absence of variables, specify the project path on the Main tab. In my case, it's:
C:\arm_development\STM32F0\BlinkyLEDs\Debug\BlinkyLEDs.elf
You want to point to the .elf file so that the debugger has access to the symbols information in there. Your dialog will look similar to this:
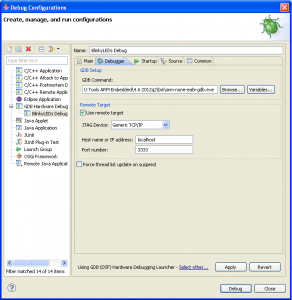
On the Debugger tab, change the GDB command by browsing to your local installation of GDB. Check the "Use remote target" checkbox. Specify "Generic TCP/IP" as the JTAG device, the hostname should be "localhost" and the port number should be 3333.
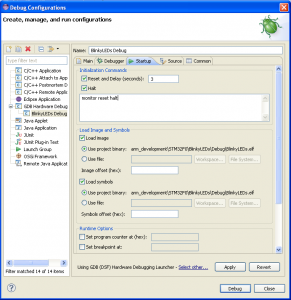
In the Startup tab, note that there are checkboxes for "Reset" and "Halt."
For whatever reason, they don't work. In order to get OpenOCD to halt the processor when we connect, enter the command "monitor reset halt" in the textbox. Leave the rest of the controls alone.
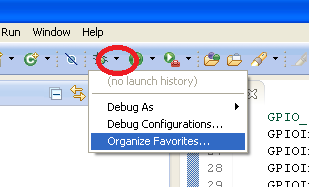
Click the Apply button, then the Close button. To make things easier on you, once again click on the down-arrow next to the Debug icon, and select "Organize Favorites."
Click the Add button, then check the newly created debug configuration. This causes the debug configuration to appear on the drop-down list when you click on the down arrow next to the Debug icon.
Step 5: Start OpenOCD
Before starting your debug session, you must launch OpenOCD so that the Eclipse GDB client has a server to connect to. Launch OpenOCD with the parameter "-f board\stm32f0discovery.cfg." You may want to create a shortcut for this; you'll be using it often.
Step 6: Debug!
Once OpenOCD is running, click on the down-arrow next to the Debug icon and click on your debug configuration. Eclipse will build your project then debug it. You may be prompted to switch to the Debug perspective; if this happens, check the box to do this every time and select yes. Eclipse will tell OpenOCD to download the newly built code into the target processor, and the processor will be reset and halted. The debug perspective won't show you a whole lot at this point and it may in fact seem that nothing productive has just happened. Click on the OpenOCD window to verify that Eclipse made the connection:
Here you can see that OpenOCD accepted a 'gdb' connection on port 3333. There's no real evidence in the output that the target was flashed with the new code, but it was.
At this point the processor's PC is undefined. The processor is held in reset by ST-Link. When the processor comes out of reset it will read the reset vector and set the program counter. Click the Step Into icon to single step the processor:
The PC will advance to the start of Reset_Handler(), which in my case is 0x08000124. (The address on your system may be different.) Note that Eclipse says there's no source available for Reset_Handler():
I don't know why that is; clearly we did provide source code for this function. It appears that Eclipse can't resolve assembler source code.
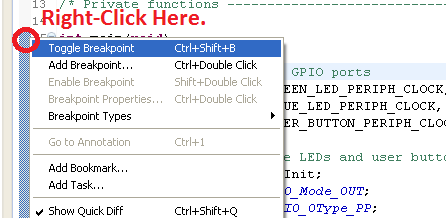
Set a breakpoint at the entry to main(). Do this by opening main.c (you can switch to the C/C++ perspective to do this) in the text editor. Right-click in the left margin and select "Toggle Breakpoint."
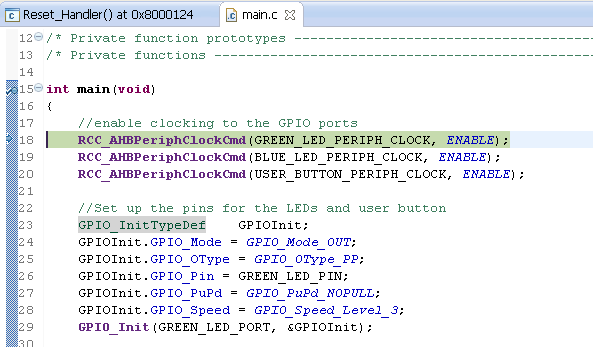
The margin will show a breakpoint icon at the line where you just set the breakpoint.
Go back to the Debug perspective and click the Resume button (or press F8). Eclipse will run your code until the breakpoint is hit. The source code line that is about to be executed will be highlighted:
You can do all the typical debug functions: you can examine and modify memory and variables, you can single-step through your code, etc.
With the tools that you've configured for yourself through this tutorial series, you should be ready to do ARM development work on the STM32F0Discovery board!





In the step where you explain to establish a connection using telnet on port 4444. You sould refer to this manual as wel (link at the bottom of my comment). Because in the newer windows versions (vista and so on) Telnet is not a standard feature anymore. And your CMD does not recognize a telnet command. This got me stuck for a moment, but after some googling i found the solution to this. See link:
http://www.sysprobs.com/telnet-windows-7
Nevermind my previous comment, Typical case of RTFM 🙂
Hello,
thanks again for your work..
I just find an easy way to set a variable to the application we want to debug. I just put :
Debug\${project_name}.elf
instead of your :
C:\arm_development\STM32F0\BlinkyLEDs\Debug\BlinkyLEDs.elf
and it seems to work the same way.
but for now it’s totally useless since that when I copy/paste my template project the debug configuration is not copied with it…
Fred
about my precedent comment, sorry, did more tests and doesn’t seem to work again.. will search again later.
Hi Mathew,
I dont know if I can post this in here or not, but I think you can help me. I am having powerpc-elf-gcc installed in my linux machine for cross compiling. When I am trying to compile and create an executable file from a c file, I get the error undefined reference to _exit in exit.c(header). I have tried including the header file that contains the definition of _exit that I found from exit.c in my program but that wont work. I tried giving a definition of _exit function in my program but I am not supposed to use it itseems.I also tried rebuilding the cross compiler but with no luck. So, is there any way that I can deal with it? Thanks in advance
Thanks for the great tutorial it really helped me get the GNU tools working with the STM32F429 Discovery board.
I’ve learn some just right stuff here. Certainly price bookmarking for revisiting.
I wonder how much effort you place to create this type of great informative website.